Image Details
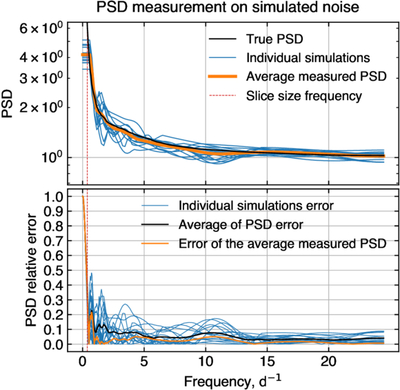
Caption: Figure 5.
Top panel: example of PSD estimation for several simulated noise samples. The black line is the true PSD used to generate the noise. The blue lines represent individual measurements, while the orange line shows the average PSD from these measurements. The red vertical line marks the resolution limit of frequencies whose power can be measured. Power below this threshold is removed. Bottom panel: relative error of the measurements from the top panel. The blue lines correspond to different noise samples. The black line is the average of the blue lines. The orange line is the error of their average (marked by the orange line in the top panel).
Other Images in This Article
Show More
Copyright and Terms & Conditions
© 2025. The Author(s). Published by the American Astronomical Society.