Image Details
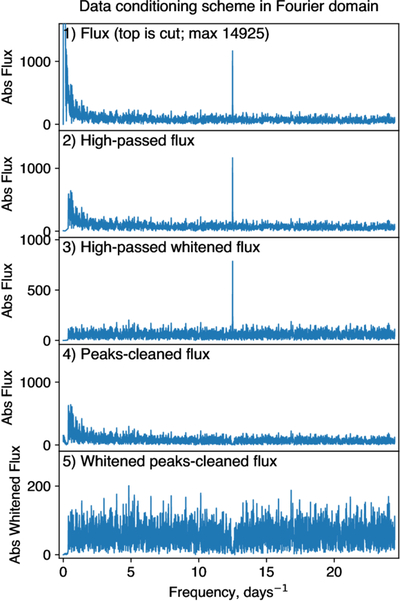
Caption: Figure 2.
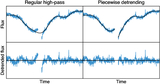
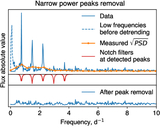
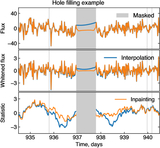
Schematic of data conditioning on a simulated light curve represented in Fourier domain. (1) The original correlated (red noise) flux, including an additional noise peak. (2) The flux after detrending the low frequencies that cannot be resolved by the measured PSD. (3) The flux whitened after the PSD was measured and the whitening filter was constructed. (4) The flux after the peak detection and removal. (5) The final whitened flux, which will be used for statistic score calculation.
Other Images in This Article
Show More
Copyright and Terms & Conditions
© 2025. The Author(s). Published by the American Astronomical Society.
Copyright ©
2025 Astronomy Image Explorer. All Rights Reserved.