Image Details
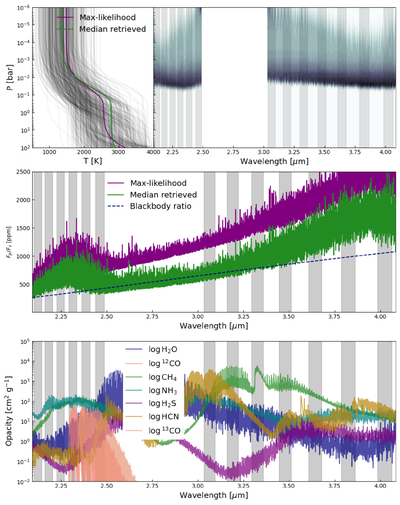
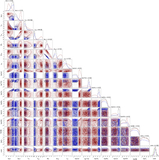
Caption: Figure 3.
Top left: retrieved median and maximum-likelihood P–T profiles, with 500 P–T profiles drawn from the posterior in black. Top right: maximum-likelihood emission contribution function, with observed orders shaded. Center: Fp/Fs for the maximum-likelihood and median retrieved planet models, compared with the expected Fp/Fs assuming the planet and star are blackbodies at their respective equilibrium and effective temperatures. Observed orders are shaded. Bottom: opacities of the species included in the retrieval over the observed bandpass.
Other Images in This Article
Copyright and Terms & Conditions
© 2025. The Author(s). Published by the American Astronomical Society.
Copyright ©
2025 Astronomy Image Explorer. All Rights Reserved.