Image Details
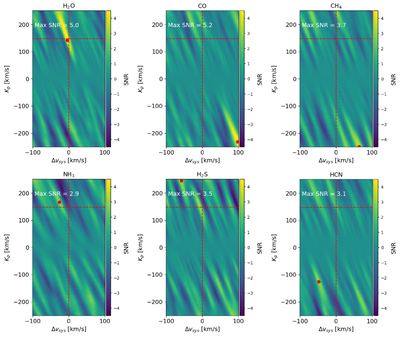
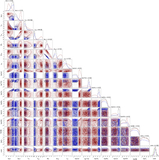
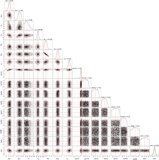
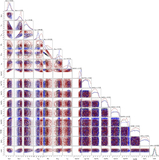
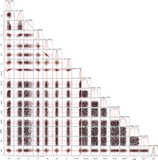
Caption: Figure 2.
Kp–Δvsys plots for each molecule. Planet models were generated using the maximum-likelihood parameters, setting the specified mass fraction to 10−1.5 and all others to 10−15. Only H2O shows a clear peak consistent with the ephemeris of HD 209458 b. While CO, H2S, and HCN show SNR ∼ 3 peaks consistent with the planet, comparison to other molecules shows that features of comparable strength regularly appear at random locations in the Kp–Δvsys space. CO shows a strong peak at very negative Kp, which may be a result of stellar or telluric contamination.
Other Images in This Article
Copyright and Terms & Conditions
© 2025. The Author(s). Published by the American Astronomical Society.
Copyright ©
2025 Astronomy Image Explorer. All Rights Reserved.