Image Details

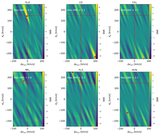
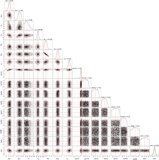
Caption: Figure 1.
Kp–Δvsys plots for the K-band (left), L-band (center), and combined (right) data sets using the maximum-likelihood retrieved planet model. HD 209458 b is weakly detected (SNR ≈ 4) in each band individually, improving to SNR ∼ 5 when both epochs are combined. The SNR is estimated by first median-subtracting each row of the Kp–Δvsys plots, then dividing by the standard deviation of the negative Kp region, which results in a slight offset of the maximum (indicated by a red dot) from the values in Table 2. See L. Finnerty et al. (2024, 2025a) for a more detailed discussion of the issues with estimating noise in Kp–Δvsys plots.
Other Images in This Article
Copyright and Terms & Conditions
© 2025. The Author(s). Published by the American Astronomical Society.