Image Details
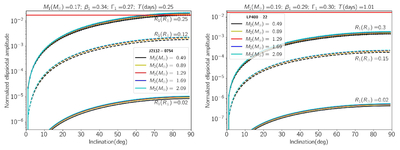
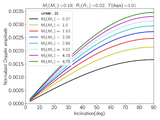
Caption: Figure 4.
The amplitudes of ellipsoidal variations for two targets J2132+0754 and LP400−22 vary with the inclination angle and by considering different values for the mass of the secondary components (represented by different colors) and the radius of the primary components (represented by different line styles). The thick red lines represent the amplitudes of the observed periodic trends in their TESS light curves Δn. We utilize the analytical relation provided by S. L. Morris & S. A. Naftilan (1993) to evaluate the amplitude of the ellipsoidal variation.
Other Images in This Article
Copyright and Terms & Conditions
© 2025. The Author(s). Published by the American Astronomical Society.
Copyright ©
2025 Astronomy Image Explorer. All Rights Reserved.