Image Details
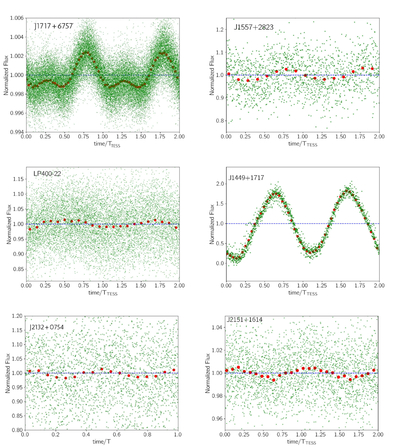
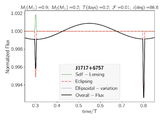
Caption: Figure 2.
The TESS folded light curves for six DWD systems whose periodograms are displayed in Figure 1. The name of each system is mentioned inside the panel. The binned data are represented by red circles. To better discern the periodic trends in data, we have included horizontal blue lines indicating constant flux in each panel.
Other Images in This Article
Copyright and Terms & Conditions
© 2025. The Author(s). Published by the American Astronomical Society.
Copyright ©
2025 Astronomy Image Explorer. All Rights Reserved.