Image Details
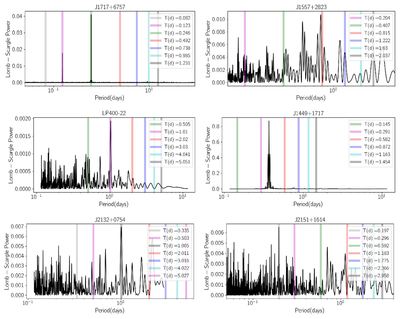
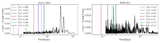
Caption: Figure 1.
The LS periodograms related to the TESS light curves of six known DWD systems. The name of each target is reported at the top of each panel. The thick colored and vertical lines specify the orbital period, its half, double, triple, etc. These lines are depicted to compare the orbital period and its proper fractions/multiples with the period of their most-dominant signal with the maximum LS power.
Other Images in This Article
Copyright and Terms & Conditions
© 2025. The Author(s). Published by the American Astronomical Society.
Copyright ©
2025 Astronomy Image Explorer. All Rights Reserved.