Image Details
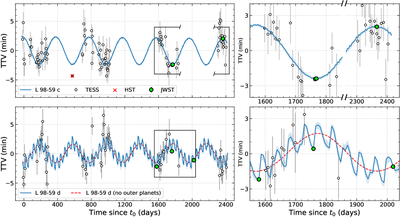
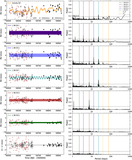
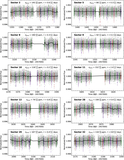
Caption: Figure 5.
Transit timing variations (TTVs) of L 98-59 c (top) and L 98-59 d (bottom) from TESS (white circles), HST (red cross), and JWST (green circles) with a zoomed-in region shown on the right. The HST partial transit of L 98-59 c was not included in the fit. The blue curve depicts the median TTV model from the joint RV–TTV fit using a fixed inclination for all planets. A 68% confidence envelope is shown in lighter blue and was determined from 1000 random solutions drawn from the posterior distribution. The red dashed curve shows a TTV model without the outer nontransiting planets L 98-59 e and f.
Other Images in This Article
Show More
Copyright and Terms & Conditions
© 2025. The Author(s). Published by the American Astronomical Society.