Image Details
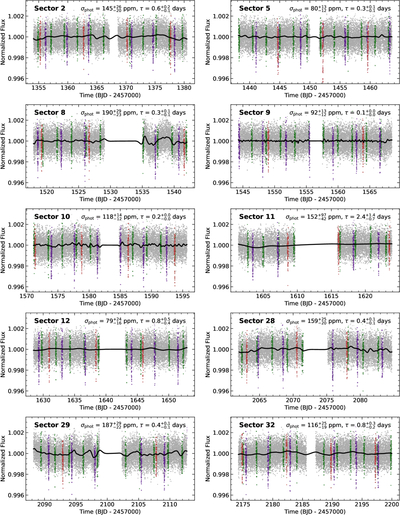
Caption: Figure A1.
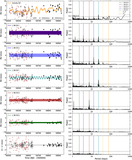
Normalized PDCSAP light curve of L 98-59 from TESS between 2018 August 23 (sector 2) and 2025 April 9 (sector 90). Photometry taken during the transit of L 98-59 b, c, and d is highlighted in green, purple, and red, respectively. The black line is the median GP model of the out-of-transit light curve (details in Section 3.1). The GP amplitude (σphot) and coherence timescale (τ) are indicated for each sector. Our GP models were compatible with a baseline flux f0 = 1 and no additional jitter (σjitter = 0 ppm) for all sectors.
Other Images in This Article
Show More
Copyright and Terms & Conditions
© 2025. The Author(s). Published by the American Astronomical Society.
Copyright ©
2025 Astronomy Image Explorer. All Rights Reserved.