Image Details
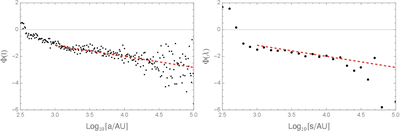
Caption: Figure 3.
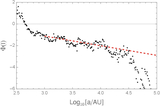
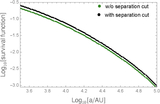
Left: the differential function Φ(l) (Equation (7)) related to the power index γ(l) in the tail of PDF(a) reconstructed by the direct mapping technique. The dashed red line shows the linear fit for the interval l ∈ [3, 5]. Right: the empirical function Φ(λ) estimated from the actual histogram of ﹩\lambda ={{\mathrm{log}}}_{10}\,(s)﹩. The dashed red line is the same linear fit as in the left panel, for reference.
Other Images in This Article
Copyright and Terms & Conditions
© 2025. The Author(s). Published by the American Astronomical Society.
Copyright ©
2025 Astronomy Image Explorer. All Rights Reserved.