Image Details
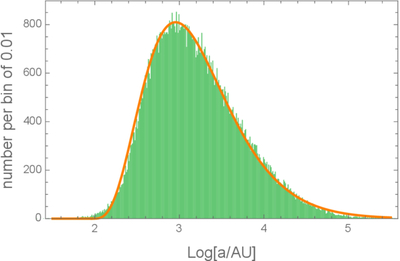
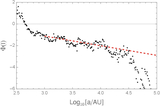
Caption: Figure 2.
Distribution (histogram in green) of the logarithms of semimajor axes between the components of resolved binary systems in Gaia DR3 from the catalog by K. El-Badry et al. (2021) by direct Monte Carlo mapping. The orange line is the numerically fitted analytical distribution given by Equation (5).
Other Images in This Article
Copyright and Terms & Conditions
© 2025. The Author(s). Published by the American Astronomical Society.
Copyright ©
2025 Astronomy Image Explorer. All Rights Reserved.