Image Details
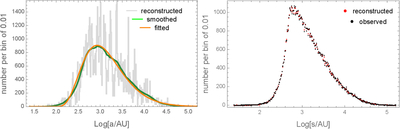
Caption: Figure 4.
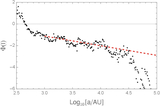
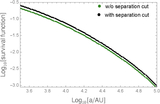
Numerically reconstructed probability density of orbit sizes a and apparent separation s per decibel using the IF method. Left: the orange line is a fit given by Equation (12), and the green curve is a kernel smoothing result of the actual reconstructed PDF, which is shown with the gray line. Right: the observed (blue) and reconstructed (red) histograms of ﹩{{\mathrm{log}}}_{10}\,(s)﹩.
Other Images in This Article
Copyright and Terms & Conditions
© 2025. The Author(s). Published by the American Astronomical Society.
Copyright ©
2025 Astronomy Image Explorer. All Rights Reserved.