Image Details
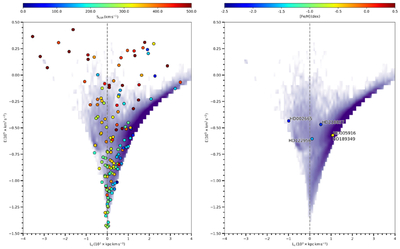
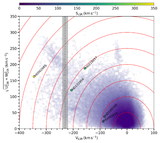
Caption: Figure 8.
Orbital properties of five stars in the Lindblad diagram. Color-coded distribution of stellar angular momentum (Ltot) over the Milky Way stellar density map, with colored circles marking GC positions in the Galaxy (left panel). The same diagram is color-coded according to metallicity (right panel). The overplotted labeled markers indicate the positions of the selected stars (HD 122956, HD 189349, HD 005916, HD 122956, and HD 218857) used in this study. The vertical dashed line corresponds to Lz = 0, which separates prograde (right) and retrograde (left) orbits.
Other Images in This Article
Show More
Copyright and Terms & Conditions
© 2025. The Author(s). Published by the American Astronomical Society.
Copyright ©
2025 Astronomy Image Explorer. All Rights Reserved.