Image Details
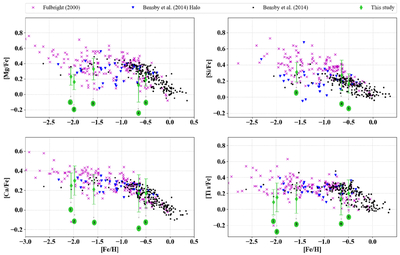
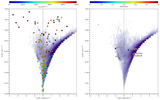
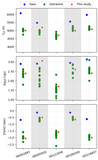
Caption: Figure 7.
Abundance ratios of α-elements ([Mg/Fe], [Si/Fe], [Ca/Fe], and [Ti I/Fe]) as a function of metallicity ([Fe/H]) for stars analyzed in this study (green diamonds with error bars and numbered from 1 to 5, in order of increasing metallicity: HD 2665 (1), HD 218857 (2), HD 122956 (3), HD 189349 (4), and HD 5916 (5)) compared to literature data. The data from J. P. Fulbright (2000) are shown as pink crosses, and the magenta squares indicate the mean values for metal-poor dwarfs from J. P. Fulbright (2000). The blue downward triangles represent halo stars from T. Bensby et al. (2014), and their mean values are shown as larger blue symbols. Black dots represent thick disk stars from T. Bensby et al. (2014), and large black dots indicate the average abundances in 0.25 dex intervals of [Fe/H] for thick disk stars. Individual error bars in the [X/Fe] axis for the metal-poor HPM stars are also indicated.
Other Images in This Article
Show More
Copyright and Terms & Conditions
© 2025. The Author(s). Published by the American Astronomical Society.