Image Details
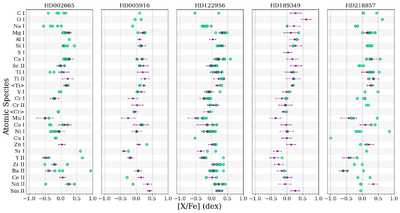
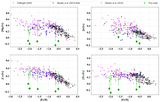
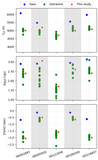
Caption: Figure 10.
Comparison of elemental abundance ratios [X/Fe] for the five program stars analyzed in this study (purple stars with error bars) against values compiled from the literature (cyan circles). Each panel corresponds to a different star, with the vertical axis listing the atomic species and the horizontal axis representing the [X/Fe] abundance ratio in dex units. Error bars indicate the ±1σ uncertainties of the measurements derived in this study. For elements for which both neutral and ionized species are available (e.g., Ti I, Ti II, Cr I, and Cr II), we included all individual measurements as well as their averaged abundances. The combined [X/Fe] values are shown to facilitate comparison with literature studies that report only averaged quantities.
Other Images in This Article
Show More
Copyright and Terms & Conditions
© 2025. The Author(s). Published by the American Astronomical Society.