Image Details
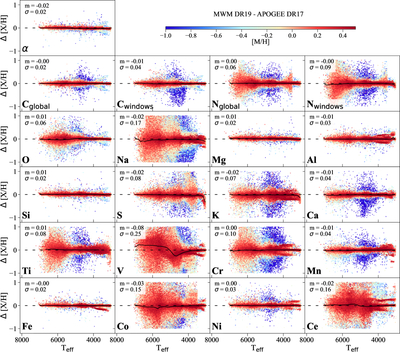
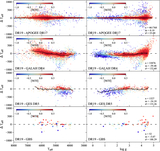
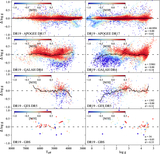
Caption: Figure 19.
Comparison between MWM DR19 and APOGEE DR17 abundances as a function of Teff color coded by MWM [M/H]. S/N was restricted to be larger than 50 in both surveys. Abundances of Cglobal and Nglobal are from the global fit. The solid black line shows the running median value.
Other Images in This Article
Show More
Copyright and Terms & Conditions
© 2025. The Author(s). Published by the American Astronomical Society.
Copyright ©
2025 Astronomy Image Explorer. All Rights Reserved.