Image Details
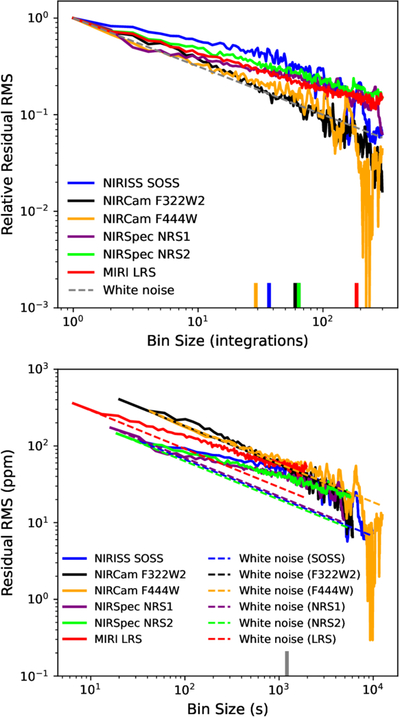
Caption: Figure 4.
Results of time-averaging tests for each of our broadband fits (Figure 3). Top: plotting the rms of the data–model residuals, relative to the unbinned case, as a function of the number of integrations per bin N. The expected behavior of pure white noise is indicated by the dashed gray line, which falls off as ﹩1/\sqrt{N}﹩. Bottom: plotting the raw rms as a function of the actual temporal size of each bin. The expected white noise behaviors, different for each instrument, are plotted as dashed colored lines. Results for NIRISS are shown in blue, NIRCam F322W2 in black, NIRCam F444W in orange, NIRSpec NRS1 in purple, NIRSpec NRS2 in lime, and MIRI LRS in red. At the bottom, the small vertical lines indicate the length of transit ingress/egress for reference, either in units of each instrument’s integration time (top) or the actual time (bottom).
Other Images in This Article
Show More
Copyright and Terms & Conditions
© 2025. The Author(s). Published by the American Astronomical Society.