Image Details
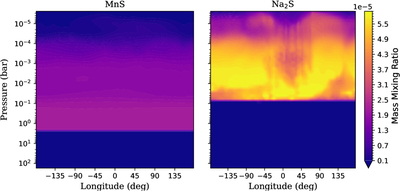
Caption: Figure 10.
Spatial distributions of MnS (left) and Na2S (right) clouds as a function of longitude, averaged over all latitudes, and pressure in our cloudy SPARC/MITgcm model. The color mapping represents the mass mixing ratio of the cloud particle, with the same scaling in each panel.
Other Images in This Article
Show More
Copyright and Terms & Conditions
© 2025. The Author(s). Published by the American Astronomical Society.
Copyright ©
2026 Astronomy Image Explorer. All Rights Reserved.