Image Details
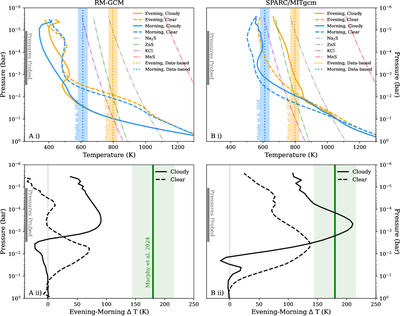
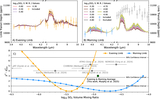
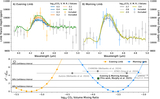
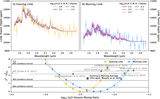
Caption: Figure 9.
Results from our two GCM families of runs of WASP-107 b. The left column (panels (Ai) and (Aii)) show the results from RM-GCM and the right column (panels (Bi) and (Bii)) from SPARC/MITgcm. The top panels ((Ai) and (Bi)) show the evening (orange) and morning (blue) terminator temperature–pressure profiles in each model for both the cloudy (solid) and clear (dashed) atmosphere cases. For reference, the vertical dotted lines and shaded regions are the evening- and morning-limb temperatures and uncertainties determined from the observed limb spectra by M. M. Murphy et al. (2024b). We also plot the approximate condensation curves for relevant species (Na2S, ZnS, KCl, and MnS) following the equations of C. V. Morley et al. (2012) for 10 × solar metallicity, but note these are independent of the GCM. The bottom panels ((Aii) and (Bii)) show the evening–morning temperature difference as a function of pressure, compared to that inferred by M. M. Murphy et al. (2024b). For reference, in each panel, the gray bar indicates the approximate range of pressures that our observations probe based on A. Dyrek et al. (2024).
Other Images in This Article
Show More
Copyright and Terms & Conditions
© 2025. The Author(s). Published by the American Astronomical Society.