Image Details
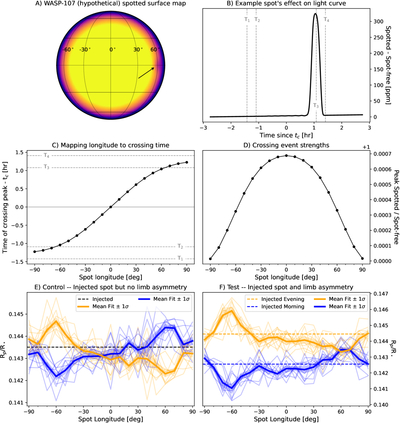
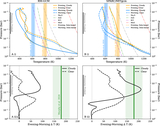
Caption: Figure D1.
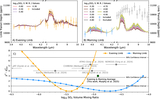
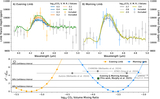
Investigating the impact starspot crossings have on our ability to detect and measure limb asymmetry. We used starry and catwoman to simulate transit observations of WASP-107 b when crossing spots at different locations on the star. Panel (A) shows an example of the starry stellar intensity map with a spot of contrast 0.1 and an angular radius of 5° at a longitude of 60°, pointed to by the arrow. Panel (B) shows its relative effect on the transit light curve via the difference between the light curve with and without the spot. Panel (C) shows how the spot longitude maps to the spot crossing’s location within the transit. Panel (D) shows the strength of the spot’s effect on the light curve as a function of its longitude via the peak value of the ratio of the light curve with and without the spot, i.e., the factor by which the relative flux increases due to the spot’s bump at its peak. In other words, the amplitude of the bump due to the spot is equal to the relative flux of the spot-free light curve at a given time (related to longitude via panel (C)) multiplied by the y-value. We then performed injection–recovery tests on these simulated spotted transit observations to test how the spot crossing impacts the best-fit evening- and morning-limb radii in cases where there is no underlying limb asymmetry (control case, panel (E)), and where there is underlying limb asymmetry (test case, panel (E)).
Other Images in This Article
Show More
Copyright and Terms & Conditions
© 2025. The Author(s). Published by the American Astronomical Society.