Image Details
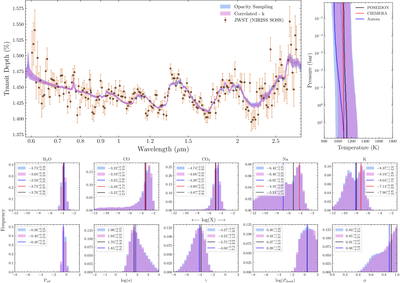
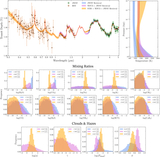
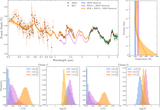
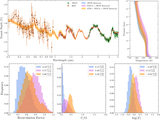
Caption: Figure 6.
Benchmarking of SANSAR retrieval with other widely used retrieval models using WASP-96 b observations from M. Radica et al. (2023) and model results from J. Taylor et al. (2023). Opacity sampling and correlated-k median transmission spectra are represented by light blue and violet colors, respectively, with 1σ uncertainty. The temperature profile is shown for both opacity sampling and correlated-k along with the 1σ error bar, whereas the median retrieved temperature profiles from POSEIDON (black), CHIMERA (red), and Aurora (blue) are also plotted on top. The bottom panel shows the posteriors of different chemical species as well as cloud and haze parameters, along with the values retrieved by other models. The median values of the posteriors from POSEIDON, CHIMERA, and Aurora are shown as solid lines.
Other Images in This Article
Show More
Copyright and Terms & Conditions
© 2025. The Author(s). Published by the American Astronomical Society.