Image Details
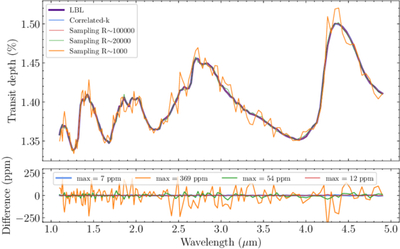
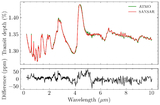
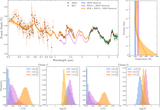
Caption: Figure 2.
LBL transmission spectra comparison with opacity sampling at a resolution of 1000, 20,000, and 100,000 (all resolutions finally binned to R ∼ 100 for comparison) and with correlated-k at R ∼ 1000. Residuals compared with LBL are shown at the bottom, and the maximum error in each case is shown in the legend.
Other Images in This Article
Show More
Copyright and Terms & Conditions
© 2025. The Author(s). Published by the American Astronomical Society.
Copyright ©
2025 Astronomy Image Explorer. All Rights Reserved.