Image Details
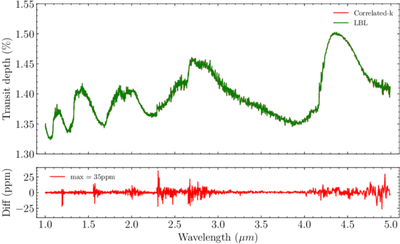
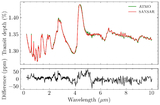
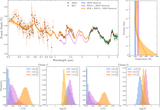
Caption: Figure 3.
Comparison between transmission spectra computed using the correlated-k opacity method and those from LBL calculations. The LBL spectra have been binned to a correlated-k wavelength grid (R ∼ 1000). Residuals are shown in the bottom panel.
Other Images in This Article
Show More
Copyright and Terms & Conditions
© 2025. The Author(s). Published by the American Astronomical Society.
Copyright ©
2025 Astronomy Image Explorer. All Rights Reserved.