Image Details
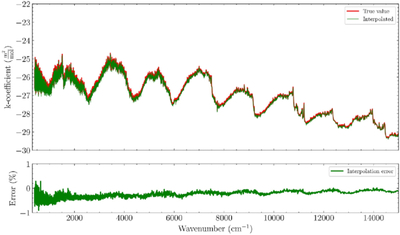
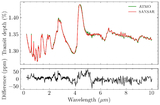
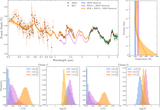
Caption: Figure 14.
This figure shows the accuracy of bicubic convolution interpolation. The red curve represents the true k-coefficient at ∼ 1 mbar and 1360 K, pressure and temperature, respectively, whereas the green curve is the interpolated. The bottom plot shows the percentage error of interpolated values with respect to the true value.
Other Images in This Article
Show More
Copyright and Terms & Conditions
© 2025. The Author(s). Published by the American Astronomical Society.
Copyright ©
2025 Astronomy Image Explorer. All Rights Reserved.