Image Details
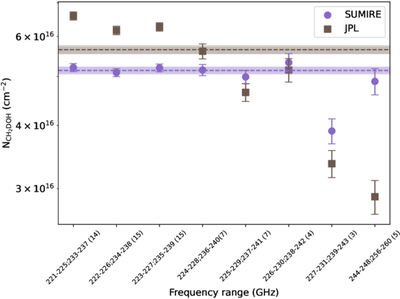
Caption: Figure 3.
Derived CH2DOH column density by using different detected transitions at various frequency ranges between 216 and 264 GHz in V883 Ori. The frequency ranges are set by roughly mimicking the spectral windows which are typically used in observation setup (e.g., F. Fontani et al. 2015; E. Bianchi et al. 2017; J. Ospina-Zamudio et al. 2019). The number in each bracket indicate the number of transitions included in the corresponding frequency range. Results employed SUMIRE and JPL spectroscopic data are indicated in purple and brown respectively. The dash line denotes the CH2DOH column density derived by including all available transitions and the shaded area denotes the associated uncertainty.
Other Images in This Article
Copyright and Terms & Conditions
© 2025. The Author(s). Published by the American Astronomical Society.