Image Details
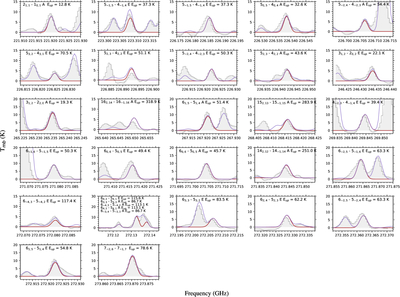
Caption: Figure 2.
Unblended and optically thin transitions of CH3OD detected in V883 Ori. The observed spectra are plotted as gray histograms in the order of increasing frequency. The best LTE fit by fixing Tex = 120 K is shown in red line and the overall fitting, i.e., by including the contribution from all other molecular species detected in V883 Ori in J.-H. Jeong et al. (2025), is in purple line. The quantum numbers and value of Eu of each transitions are listed on the upper part of each panel.
Other Images in This Article
Copyright and Terms & Conditions
© 2025. The Author(s). Published by the American Astronomical Society.
Copyright ©
2025 Astronomy Image Explorer. All Rights Reserved.