Image Details
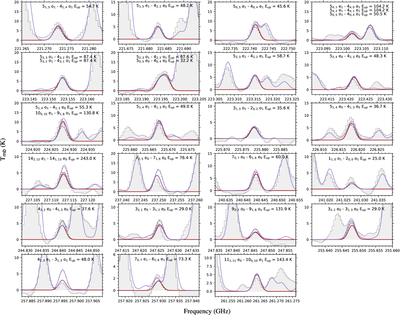
Caption: Figure 1.
Unblended and optically thin (τ ≤ 0.3) transitions of CH2DOH detected in V883 Ori. The observed spectra are plotted as gray histograms in the order of increasing frequency. Assuming the same excitation temperature (Tex = 120 K), radial velocity (νLSR), linewidth (FWHM = 3.0 km s−1), and beam-filling factor (0﹩\mathop{.}\limits^{\unicode{x02033}}﹩384), the result of the best LTE fit using spectroscopic data from JPL and SUMIRE is shown in gray dashed line and red line respectively. The overall fitting i.e., by including the contribution from all other molecular species detected in V883 Ori in J.-H. Jeong et al. (2025), is in the purple dashed line (JPL) and purple line (SUMIRE). The quantum numbers and value of Eup of each transition are listed on the upper part of each panel.
Other Images in This Article
Copyright and Terms & Conditions
© 2025. The Author(s). Published by the American Astronomical Society.