Image Details
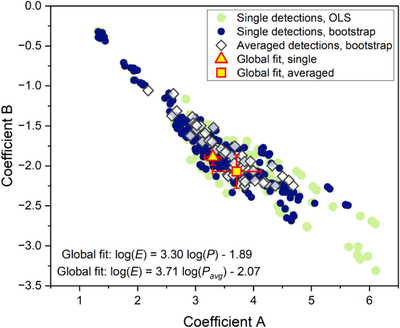
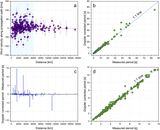
Caption: Figure 9.
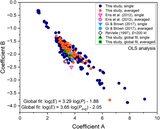
Coefficient A and B pairs for single detections (navy blue circles) and averaged detections (diamonds). Single detections derived with OLS (light green circles) are also shown, but some extreme points are cut off in this zoomed in version. Error bars for individual points are omitted to maintain clarity. The global fits, with error bars, appear as a triangle (Equation (4)) and a square (Equation (5)).
Other Images in This Article
Show More
Copyright and Terms & Conditions
© 2025. The Author(s). Published by the American Astronomical Society.
Copyright ©
2025 Astronomy Image Explorer. All Rights Reserved.