Image Details
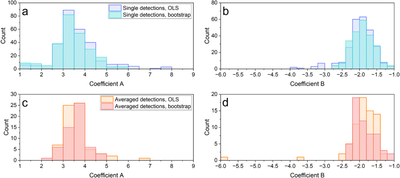
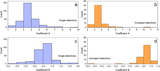
Caption: Figure 10.
Histograms of coefficients A and B for single detections (panels (a) and (b)) and averaged detections (panels (c) and (d)). The OLS results are shown with hatched bars, while the bootstrap results are shown with solid bars. Note that the axes scale is different in all panels.
Other Images in This Article
Show More
Copyright and Terms & Conditions
© 2025. The Author(s). Published by the American Astronomical Society.
Copyright ©
2025 Astronomy Image Explorer. All Rights Reserved.