Image Details
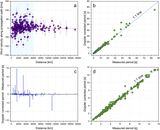
Caption: Figure 5.
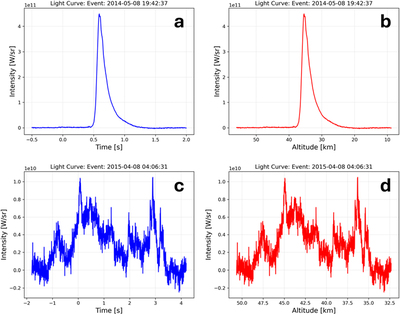
Representative examples of different classes of light curves, plotted as a function of the USG-provided time (left) and calculated altitude assuming no deceleration (right). Panels (a) and (b) show LC class 1, depicting a single dominant fragmentation event, where a single abrupt peak unfolds within 2 s and spans only about 4 km in altitude (37–33 km). This single fragmentation event is consistent with a classic “airburst” in which the entire object is abruptly vaporized due to the fragmentation. Panels (c) and (d) show LC class 2. This is a multifragmentation event, with multiple bursts across 4 s and an altitude range from 48 km down to 35 km, indicative of energy deposition over 13 km.
Other Images in This Article
Show More
Copyright and Terms & Conditions
© 2025. The Author(s). Published by the American Astronomical Society.