Image Details
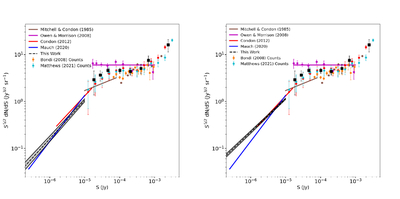
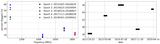
Caption: Figure 12.
Euclidean-normalized source counts. The 1.4 GHz P(D) distribution derived from the CHILES Con Pol data for the pixel ranges of 0.1–10 μJy beam−1 (left panel) and 0.1–60 μJy beam−1 (right panel) are shown by black-dashed lines. The source count derived from the CHILES Con Pol component catalog is shown by large black dots (H. B. Gim et al. 2025). They are compared with the published P(D) (K. J. Mitchell & J. J. Condon 1985; F. N. Owen & G. E. Morrison 2008; J. J. Condon et al. 2012; T. Mauch et al. 2020) and compilations of number counts by M. Bondi et al. (2008) and A. M. Matthews et al. (2021).
Other Images in This Article
Show More
Copyright and Terms & Conditions
© 2025. The Author(s). Published by the American Astronomical Society.