Image Details
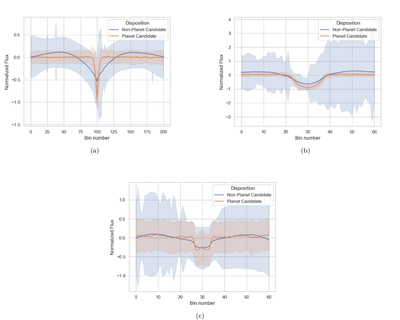
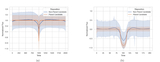
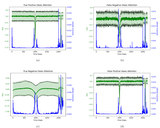
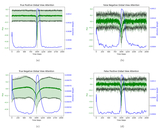
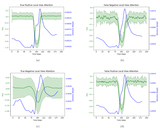
Caption: Figure 5.
Average values of (a) global, (b) local, and (c) secondary views of TESS light curves. The average of planet candidate light curves is represented by a solid orange line, with the standard deviation depicted as a shaded area around the average line in light orange. Similarly, the average of nonplanet candidate light curves is shown with a solid blue line, accompanied by the standard deviation represented as a shaded area around the average line in light blue.
Other Images in This Article
Show More
Copyright and Terms & Conditions
© 2025. The Author(s). Published by the American Astronomical Society.
Copyright ©
2026 Astronomy Image Explorer. All Rights Reserved.