Image Details
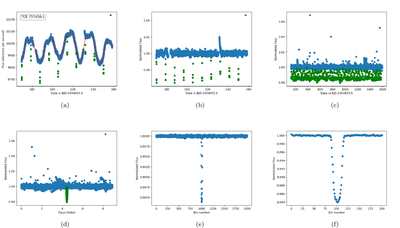
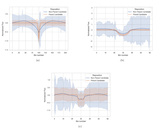
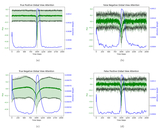
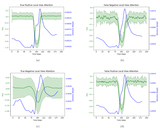
Caption: Figure 2.
Schematic representation of the light-curve processing procedure that prepares them for classification tasks within our models. We use the TCE 757450-1 to exemplify the procedure. (a) Basis spline curve (in red) fitted to the light-curve points. Transit data points are shown in green, and the rest in blue. (b) Flattened light curve after dividing the original flux data points by the fitted basis spline. The rest of the plots (from (c) to (f)) also depict flattened flux values. Panels (a) and (b) represent Quarter 2 of the light curve, and the rest of the plots show the whole light curve. (c) Concatenation of every quarter’s flattened light curves. (d) Complete light curve folded according to the transit ephemerides. (e) Global view of the original light curve. (f) Local view of the original light curve.
Other Images in This Article
Show More
Copyright and Terms & Conditions
© 2025. The Author(s). Published by the American Astronomical Society.