Image Details
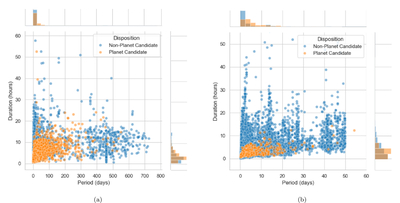
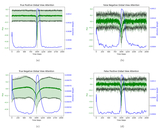
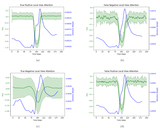
Caption: Figure 3.
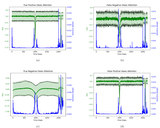
Scatter plot of the instances across orbital period and transit duration, categorized into planet candidates and nonplanet candidates for (a) Kepler and (b) TESS data sets. The top and right marginal panels in each scatter plot show normalized histograms (area = 1 for each category) along each axis.
Other Images in This Article
Show More
Copyright and Terms & Conditions
© 2025. The Author(s). Published by the American Astronomical Society.
Copyright ©
2026 Astronomy Image Explorer. All Rights Reserved.