Image Details

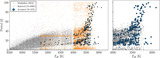
Caption: Figure 6.
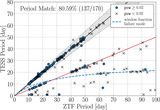
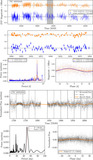
A plot comparing the periods measured from the ZTF light curves and the TESS light curves. The points are colored by their TESS peak powers. The 1:1 line with 10% uncertainties are indicated with the black line and the shaded region. The 1:2 line is indicated in red. A potential Lomb–Scargle failure mode caused by the window function of the TESS observing sector is indicated as a dashed blue line (more description in text).
Other Images in This Article

Copyright and Terms & Conditions
© 2025. The Author(s). Published by the American Astronomical Society.
Copyright ©
2025 Astronomy Image Explorer. All Rights Reserved.