Image Details

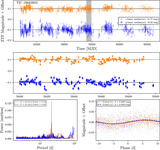
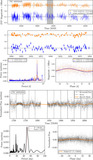
Caption: Figure 4.
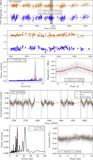
A toy example showing the offset-corrected LS periodogram. The top panel shows a simulated sinusoidal signals with some Gaussian noise. The simulated light curve is broken up into eight equal chunks, represented by different colors in the top panel, similar to how a TESS target might be observed each sector. In the middle panel we show in black what the light curve would look like if each chunk was normalized according to its own median value. We subtract 1 from each light curve chunk to center it at zero. The dotted blue line shows the best-fit model obtained by running a standard LS periodogram. The orange solid line shows the best-fit model using the offset-corrected LS periodogram. In the bottom panel we show the obtained periodogram from each of the models (i.e., standard vs. offset-corrected). See Section 3.3 for more information on the offset-corrected LS.
Other Images in This Article

Copyright and Terms & Conditions
© 2025. The Author(s). Published by the American Astronomical Society.