Image Details

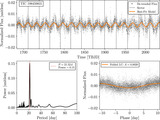
Caption: Figure 1.
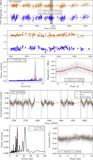
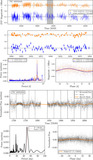
The ZTF r and g band light curves and the period analysis for TIC 198459831. In the top panel we show the r- and g-band light curves. The middle panel shows the same light curves but zooms into the shaded region between 59,400 and 59,500 days. The bottom-left panel shows the LS periodogram over the range of 2–100 days. In the bottom right panel we show the phase-folded light curve, folded at the period with the highest LS power, and overlay the sinusoidal model at this period. We also indicate A, the semiamplitude of the oscillation.
Other Images in This Article

Copyright and Terms & Conditions
© 2025. The Author(s). Published by the American Astronomical Society.
Copyright ©
2025 Astronomy Image Explorer. All Rights Reserved.