Image Details
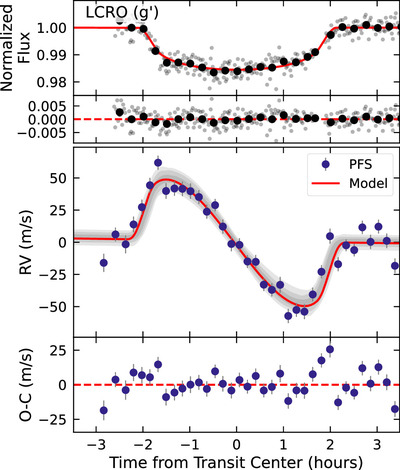
Caption: Figure 4.
In-transit photometric data from LCRO (top) and PFS RV measurements (bottom) for WASP-193, taken on the night of 2024 February 27. The LCRO photometry was fit as part of our global EXOFASTv2 analysis, and the transit constraints used as priors for the rmfit analysis of the RM effect seen in the PFS RVs. The red line shows the best-fitting model, and the gray shaded regions in the lower panel show the 1, 2, and 3σ confidence intervals for the RM model. The LCRO g’ band data shown in the top panel is available in machine-readable form. Also included, but not shown, is the TMMT I band photometry. The TMMT data was not used in the final analysis but it could be useful for future analysis. Both datasets contain detrending variables to detrend the light curves.
(The data used to create this figure are available in the online article.)
(The data used to create this figure are available.)
Other Images in This Article
Copyright and Terms & Conditions
© 2025. The Author(s). Published by the American Astronomical Society.