Image Details
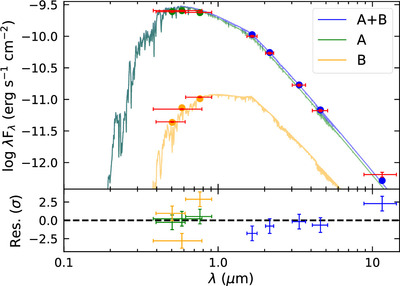
Caption: Figure 2.
Modeled two-component SED for the WASP-193AB system, based on the best-fitting stellar model from the EXOFASTv2 fit. The circles show the model broadband averages, while the red crosses denote observed fluxes from the Gaia, 2MASS, and WISE catalogs. The horizontal error bars represent the filter bandwidths. The lower panel shows the differences between the observed and modeled fluxes, colored according to whether the observation represents the flux from WASP-193A (green), WASP-193B (yellow), or a blend of both (blue).
Other Images in This Article
Copyright and Terms & Conditions
© 2025. The Author(s). Published by the American Astronomical Society.
Copyright ©
2025 Astronomy Image Explorer. All Rights Reserved.