Image Details
Caption: Figure 1.
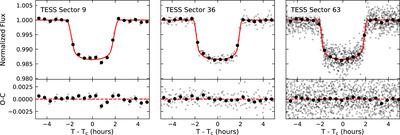
TESS light curves of WASP-193 from Sectors 9, 36, and 63 (left to right), phase folded and clipped around the transit of WASP-193 b. Solid black points show measurements binned to 30 minute intervals. The red line shows the best-fitting tranist model. The detrended TESS photometry used to create this figure are available in machine-readable form.
(The data used to create this figure are available in the online article.)
(The data used to create this figure are available.)
Other Images in This Article
Copyright and Terms & Conditions
© 2025. The Author(s). Published by the American Astronomical Society.
Copyright ©
2025 Astronomy Image Explorer. All Rights Reserved.