Image Details
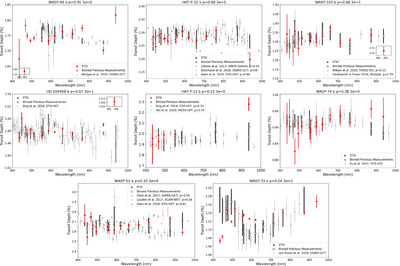
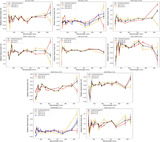
Caption: Figure 6.
A visual comparison of the transmission spectra measured with ETSI (red data points) and other observatories (black points are bins and gray points are raw data). The figures are ordered from top left to bottom right by decreasing p-value. All comparisons between ETSI and the other observatories return p-values which suggest there is not enough evidence to determine the measurements are statistically dissimilar (p > 0.05). We also find no comparison has more than two points across all 15 bandpasses with a discrepancy more than 3σ.
Other Images in This Article
Copyright and Terms & Conditions
© 2025. The Author(s). Published by the American Astronomical Society.
Copyright ©
2025 Astronomy Image Explorer. All Rights Reserved.