Image Details
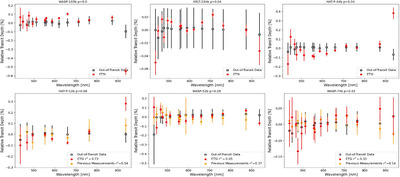
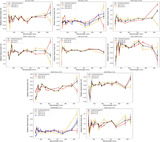
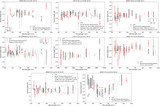
Caption: Figure 5.
A visual comparison of transmission spectra measured for various planets during transit (red points) and out of transit (black points). The p-value of the Anderson–Darling test comparing the two measurements is shown in the title of each subfigure. The out-of-transit measurements were generated via 1000 bootstrap simulations where the white-light transit signal (see Table 3) was injected at various times of midtransit and measured the same way as the in-transit data. The top row of planets have a calculated p-value of p < 0.05 indicating the in-transit and out-of-transit data are statistically different from one another. The bottom row of planets have p-values of p > 0.05 indicating they are not statistically dissimilar to the bootstrap simulations. For these planets we additionally compared previous measurements from the Exoplanet Archive with a flat line using the R2 metric. We find the previous measurements all have an R2 < 0.54, which suggests the atmospheric signal is likely consistent with a flat line and the consistency between the in-transit and out-of-transit observations may be because the spectrum is naturally featureless.
Other Images in This Article
Copyright and Terms & Conditions
© 2025. The Author(s). Published by the American Astronomical Society.