Image Details
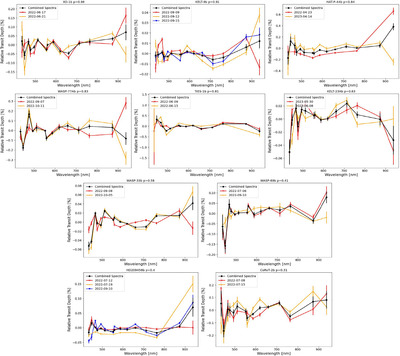
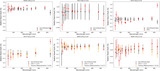
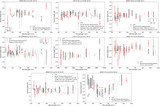
Caption: Figure 4.
A visual comparison of the transmission spectra measured with ETSI on separate nights. The final combined spectra are shown as a black line and the spectra for each night are shown as colored lines (red, orange, and blue). The spectra are ordered from large p-values on the top left to smaller p-values on the bottom right. All exoplanets with multiple observations of their transmission spectra have large p-values (p ≥ 0.31) indicating there no exoplanets with statistically dissimilar observations even though the transmission spectra were measured days, weeks, months, and even years apart.
Other Images in This Article
Copyright and Terms & Conditions
© 2025. The Author(s). Published by the American Astronomical Society.
Copyright ©
2025 Astronomy Image Explorer. All Rights Reserved.