Image Details
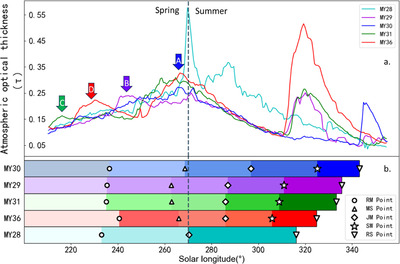
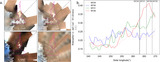
Caption: Figure 3.
(a) Average atmospheric optical thickness in the Martian south polar region (60°S–90°S). Arrows A-D indicate the peaks of higher atmospheric optical thickness in different Martian years. (b) The recession process and the time steps of the SPSC in different Martian years, ordered up to down by the timing of the recession end dates. The shaded color bar in the figure represents the phases divided by each time step.
Other Images in This Article
Copyright and Terms & Conditions
© 2025. The Author(s). Published by the American Astronomical Society.
Copyright ©
2026 Astronomy Image Explorer. All Rights Reserved.