Image Details
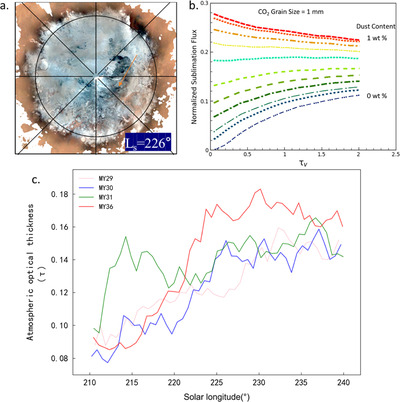
Caption: Figure 4.
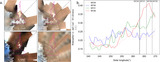
(a) Schematic diagram of the “cryptic region” (with orange arrows pointing to the area). (b) Sublimation flux of carbon dioxide ice with a grain size of 1 mm as a function of atmospheric optical thickness (adapted from P. B. Bonev et al. 2003). (c) Average atmospheric optical thickness of the “cryptic region” during the period Ls = 210°–240°.
Other Images in This Article
Copyright and Terms & Conditions
© 2025. The Author(s). Published by the American Astronomical Society.
Copyright ©
2026 Astronomy Image Explorer. All Rights Reserved.