Image Details
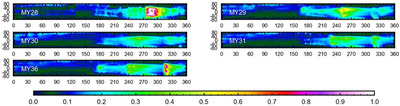
Caption: Figure 2.
Atmospheric optical thickness for different Martian years. For each subpanel, the vertical axis represents latitude, and the horizontal axis represents solar longitude. The atmospheric optical thickness shown in the figure is the result of longitude averaging at each latitude.
Other Images in This Article
Copyright and Terms & Conditions
© 2025. The Author(s). Published by the American Astronomical Society.
Copyright ©
2026 Astronomy Image Explorer. All Rights Reserved.