Image Details
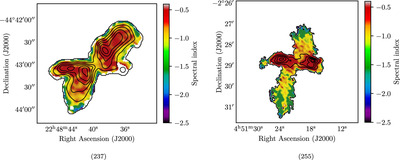
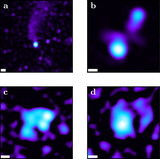
Caption: Figure 17.
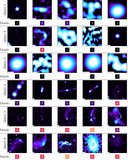
Spectral index for source 237 (left) and 255 (right), only including pixels with flux density at least 10 times higher than the rms for the image (4.00 μJy beam−1 and 7.36 μJy beam−1, respectively) and for which σα/α < 0.2. The spectral index is estimated in-band using least-squares fitting applied to the 12 sub-band images. Contours are drawn at five evenly spaced flux density levels between the minimum and the maximum flux, with background sources excluded.
Other Images in This Article
Show More
Copyright and Terms & Conditions
© 2025. The Author(s). Published by the American Astronomical Society.
Copyright ©
2026 Astronomy Image Explorer. All Rights Reserved.