Image Details
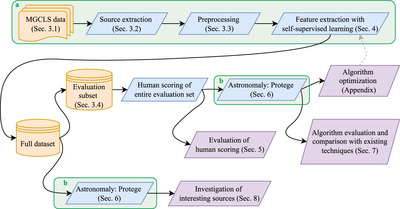
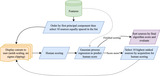
Caption: Figure 2.
High-level flowchart of the full methodology with references to relevant Sections. The section of the flowchart indicated by “a” outlines the procedure for extracting features from the raw data and is further expanded in Figure 3. After feature extraction, the analysis is divided in two, making use of a fully labeled subset of the data to evaluate performance and optimize algorithm hyperparameters and subsequently applying the methodology to the full dataset to locate and follow up high-scoring sources. In both cases, PROTEGE is used with the same settings and is described in more detail in Figure 8.
Other Images in This Article
Show More
Copyright and Terms & Conditions
© 2025. The Author(s). Published by the American Astronomical Society.