Image Details
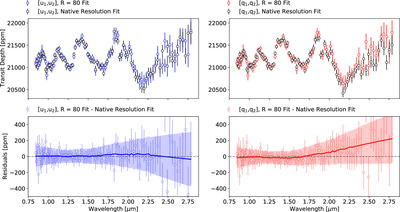
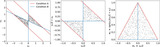
Caption: Figure 3.
Impact of the choice of limb-darkening parameterization on the measured transmission spectrum. Top left: NIRISS/SOSS spectra of WASP-39 b, fit at a spectral resolution of R = 80 (blue points) and at native resolution (black points), obtained using the [u 1, u 2] parameterization with wide uniform priors. The fit performed at native resolution is binned at a resolution of R = 80 after the light curve fitting. Bottom left: difference between the fit performed at a resolution of R = 80 and the one at native resolution (blue points) for the [u 1, u 2] parameterization. The error bars for the residuals are computed in quadrature. A smoothed version of the residuals (blue line), along with the 1σ confidence region, are shown using a linear Savitzky–Golay filter with a window size of 31 points. Top right: same as top left for the [q 1, q 2] parameterization. Bottom right: same as bottom left for the [q 1, q 2] parameterization. The residuals between the transit spectra obtained from the light-curve fits at different resolutions clearly show a systematic deviation away from 0 past 2 μm in the [q 1, q 2] case.
Other Images in This Article
Copyright and Terms & Conditions
© 2024. The Author(s). Published by the American Astronomical Society.